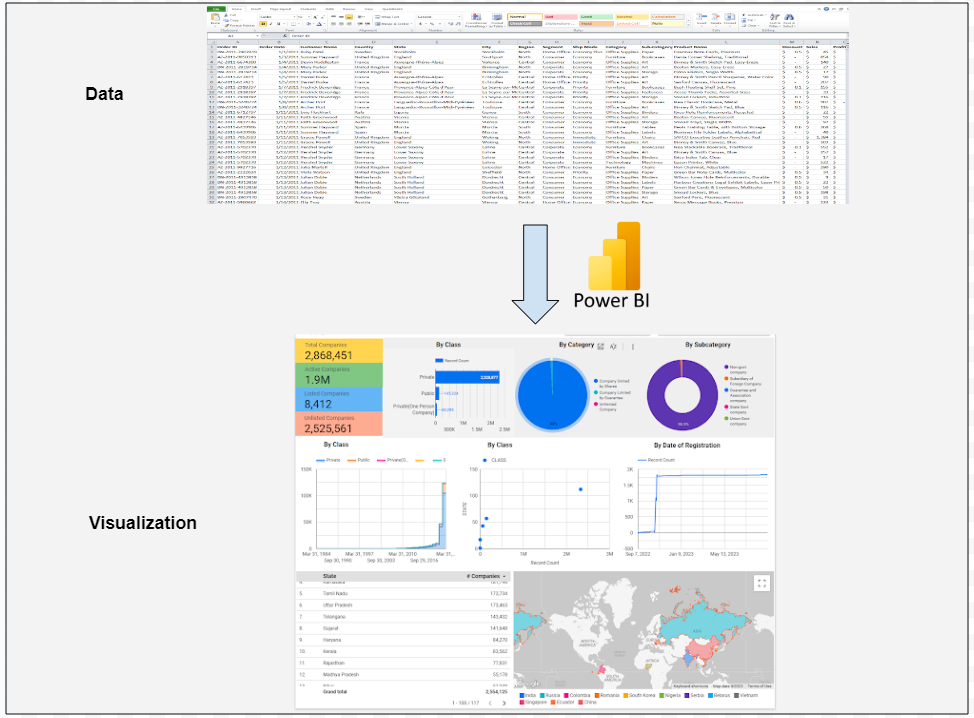
This tutorial will take you through the fundamentals of POWER BI.
A business intelligence (BI) platform called Microsoft Power BI gives non-technical business people the means to gather, analyze, visualize, and share data. With its strong interaction with other Microsoft products, Power BI is a flexible self-service tool that requires no initial training. Its user interface is pretty straightforward for Excel users.
You may connect to, manipulate, and visualize your data using the free Power BI Desktop program, which you can install on your own computer. You may connect to several different sources of data and integrate them (often referred to as modeling) into a data model using Power BI Desktop. With the help of this data model, you can create visuals and collections of visuals that you can share as reports with colleagues. The majority of customers who work on business intelligence projects write their reports using Power BI Desktop and then share them with others using the Power BI service.

Power BI may assist in fusing together various data sets, cleaning and transforming the data into a data model, and creating charts or graphs to offer visual representations of the data. All of this information may be shared with other Power BI users inside the company.
Unleashing the Full Potential of Data Visualization: Power BI’s Latest Features Take Business Insights to New Heights!
Power BI- Top Three Components
Power Pivot
To create in-memory data models, this component imports and combines various datasets from various sources. Any functional user may quickly increase the total value by merging different data sources thanks to such integration. The most well-known instances of these connections are when Power BI is used to examine corporate sales, demographic, and meteorological data. This component also allows intricate computations, key performance indicators, and other metrics that data analysts can utilize to prototype and analyze various business scenarios. For additional information, go to this Power BI beginner’s guide.
Power Query
This function, which is a game-changer for many analysts, searches for data across a variety of corporate data sources or the internet and then smoothly imports the chosen dataset into an Excel table. This component’s native data connectivity functionality makes it possible to retrieve the data more quickly and easily. Power query perform crucial data adjustments such as renaming columns, changing values, combining data, and more. This element is crucial since it makes data shaping and purification simple.
Power View
Power View is the preferred component for displaying the data and making it even more dynamic. The data is meant to be cross-filtered and highlighted. It almost seems like using Excel and PowerPoint tools while dealing with the data in the Power View component Along with supporting various maps with zoom and pan features, Power View also offers graphs, tabular data, and charts.
7 reasons to use Power BI
- A rapid start. With a simple setup, no formal training needed, and built-in dashboards for services like Salesforce, Google Analytics, and Microsoft Dynamics, you can gain insights immediately.
- streamlined distribution and publication processes. Analysts submit reports and visualizations to the Power BI service rather than sending or storing big files on a shared disk, and their data is refreshed anytime the underlying dataset is changed.
- information that is current. As data is sent or streamed in, dashboards refresh in real-time, allowing users to instantly address issues and spot possibilities. Real-time data and graphics may be shown and updated in any report or dashboard. Factory sensors, social media sites, and other sources from which time-sensitive data can be gathered or communicated can all be sources of streaming data.
- ability to alter the navigation of the Power BI software. Report makers now have the ability to adjust navigation to make it easier for users to access material quickly and comprehend the connections between various reports and dashboards thanks to an “app navigation experiences” feature.
- adaptability of security features. In order to prevent users from viewing information they shouldn’t, report developers can set up row-level security (RLS) access filters to make sure that viewers only see the data that applies to them.
- incorporation of Cortana. Cortana, Microsoft’s virtual assistant, is compatible with Power BI. Users may obtain charts and graphs by speaking inquiries in natural language. Those who utilize mobile devices may find this to be of particular benefit.
- Users of Power BI have access to text analytics and picture recognition, can build machine learning models, and can interface with Azure Machine Learning.
Advantages of Power BI
- User-friendly design: Power BI features a simple design that makes it simple for users to display and analyze data.
- Data fusion: Power BI enables users to quickly assemble data from a variety of sources, including Excel, SQL Server, and online databases like Salesforce and Azure.
- Dashboards that can be customized: Users may design dashboards and reports that can be used to present data in a way that makes sense to them.
- Real-time data processing is supported by Power BI, allowing users to access current data in their dashboards and reports.
- Collaboration: Power BI users may easily work with colleagues on data analysis projects by sharing their dashboards and results.
Disadvantages of Power BI
- Limited capacity for processing big amounts of data: Power BI was not created to handle sophisticated queries or massive datasets.
- Although Power BI offers a variety of customization possibilities, users could discover that they are constrained in their capacity to produce genuinely original visualizations and reports.
- Cost: Users who want more capabilities or storage capacity from Power BI may have to pay for it.
- Only Microsoft Windows is compatible with Power BI. This can make choosing between the two platforms much simpler. Tableau would be a better option if you plan to do most of your work on a Mac because Power BI is incompatible with Macs.


